mirror of
https://github.com/AdguardTeam/AdGuardHome.git
synced 2026-03-04 00:01:12 -05:00
Charts are off zero #3178
Labels
No labels
P1: Critical
P2: High
P3: Medium
P4: Low
UI
bug
cannot reproduce
compatibility
dependencies
docker
documentation
duplicate
enhancement
enhancement
external libs
feature request
good first issue
help wanted
infrastructure
invalid
localization
needs investigation
performance
potential-duplicate
question
recurrent
research
snap
waiting for data
wontfix
No milestone
No project
No assignees
1 participant
Notifications
Due date
No due date set.
Dependencies
No dependencies set.
Reference
starred/AdGuardHome#3178
Loading…
Add table
Add a link
Reference in a new issue
No description provided.
Delete branch "%!s()"
Deleting a branch is permanent. Although the deleted branch may continue to exist for a short time before it actually gets removed, it CANNOT be undone in most cases. Continue?
Originally created by @richardwonka on GitHub (Nov 11, 2021).
Version: v0.106.3 on current homeassistant (managed)
@ainar-g commented on GitHub (Nov 11, 2021):
Hello. There were similar issues during the v0.106 cycle, but we couldn't reproduce them, see #2942. Is there a way for you to install a beta release of AGH v0.107 and see if it's fixed there?
@richardwonka commented on GitHub (Nov 11, 2021):
I could reproduce earlier, but now it’s all good again…
I’d prefer not to do beta testing this time.
Richard Wonka
—
Throw off the bow lines! Dream! Discover!
@ainar-g commented on GitHub (Nov 11, 2021):
I see. Perhaps it has something to do with rare data shapes of the graphs that only appear every once in a while. I'll leave the issue open for a few days; please feel free to check back if this happens again.
@richardwonka commented on GitHub (Nov 11, 2021):
Thank you for the quick response. 🙂
Richard Wonka
—
Throw off the bow lines! Dream! Discover!
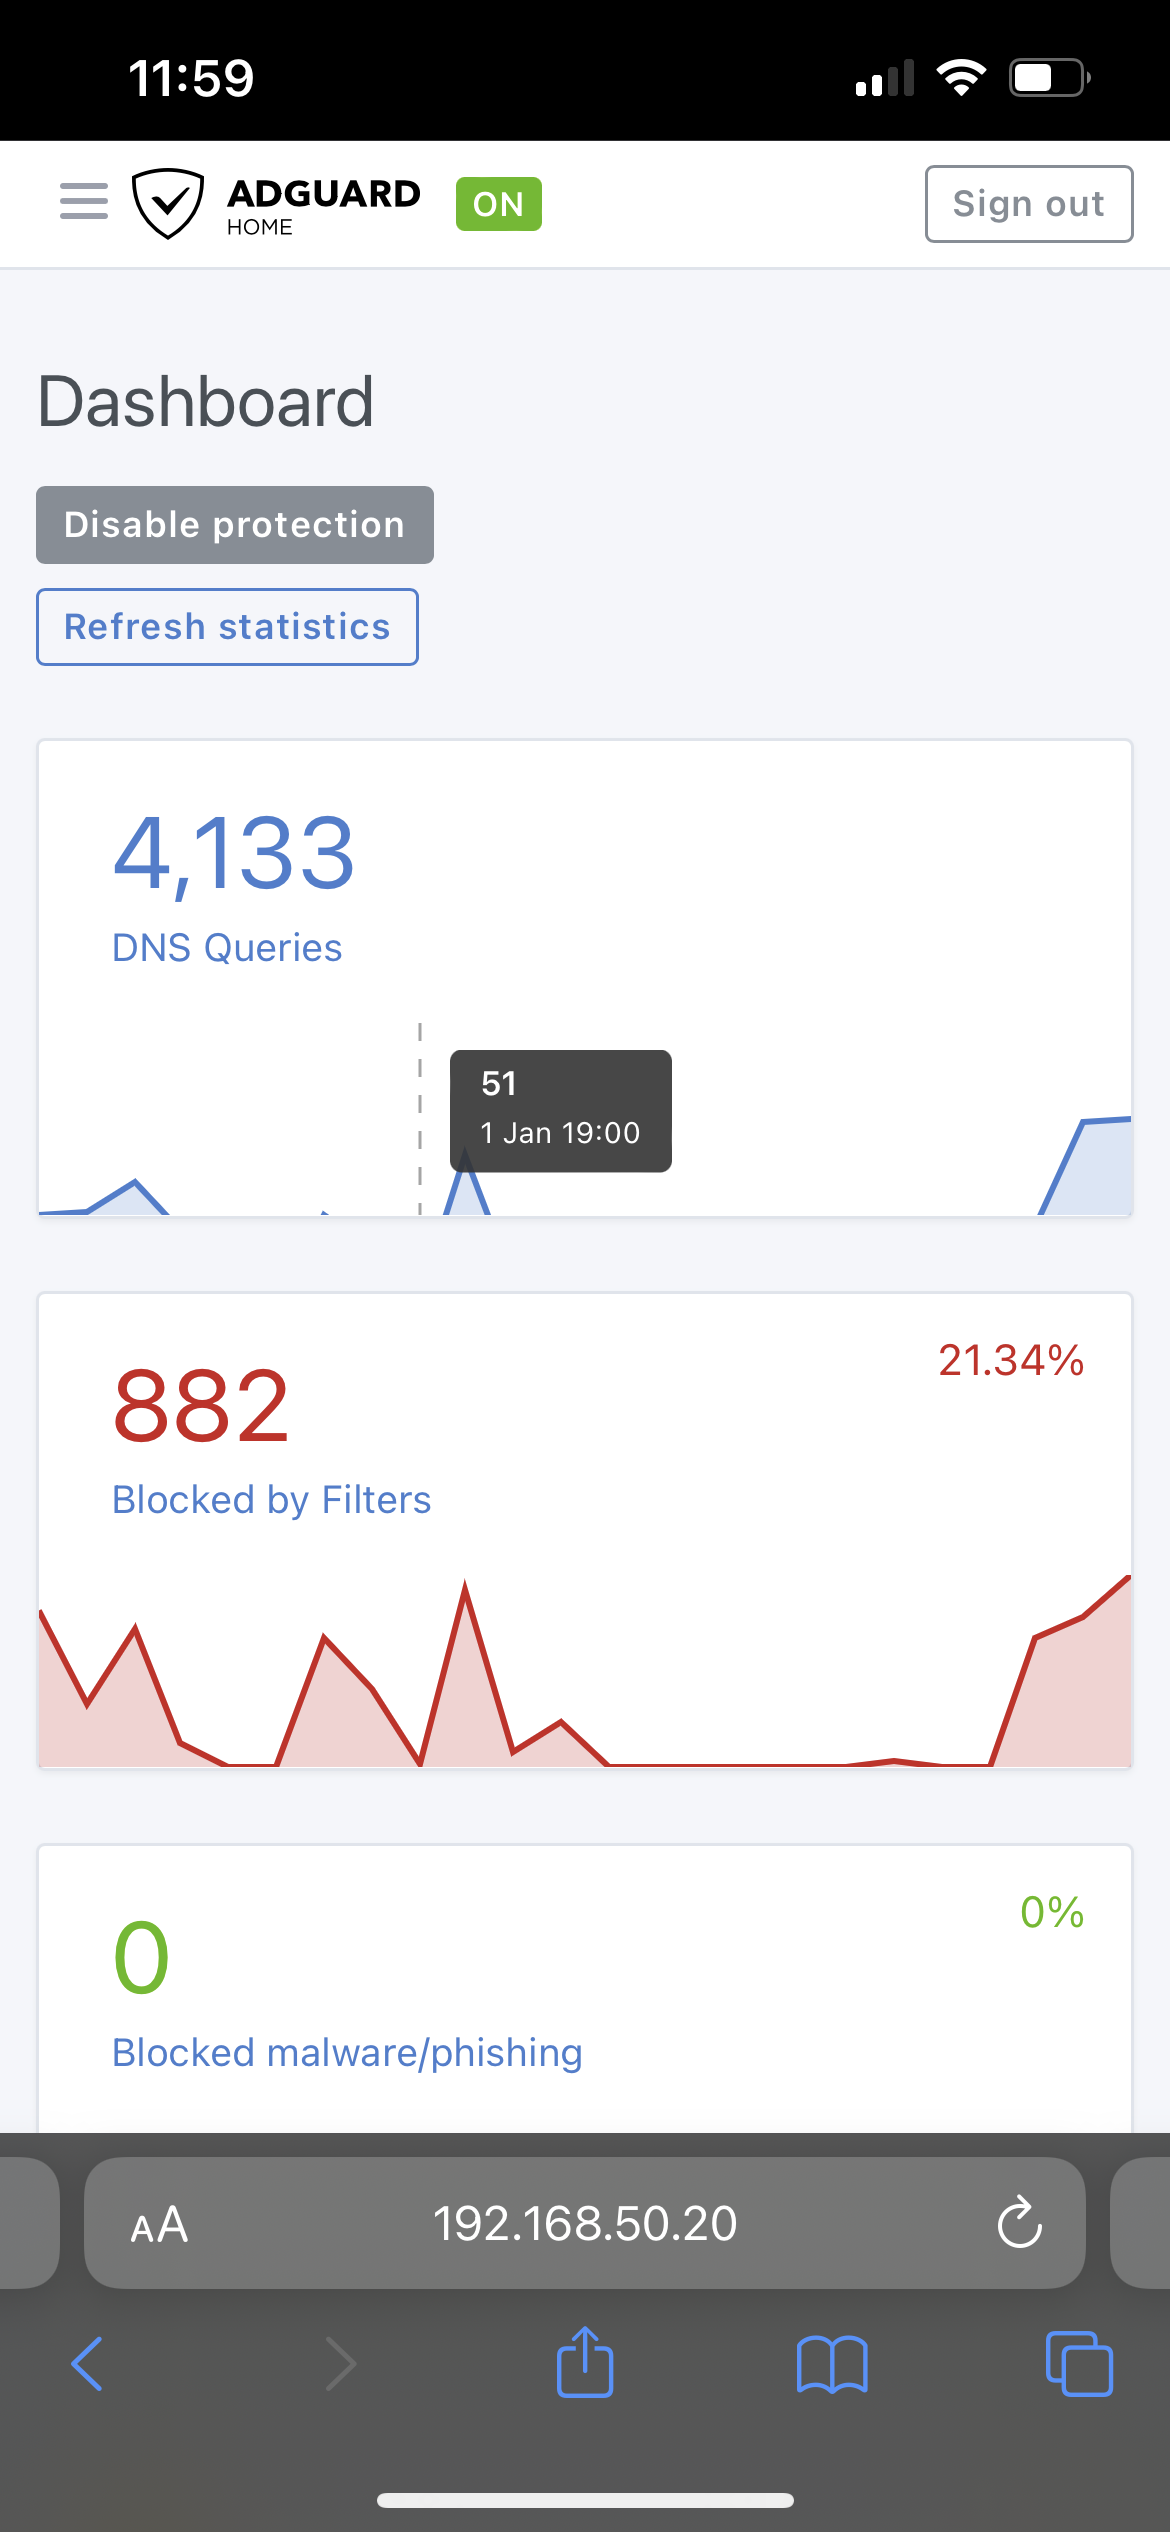
@TheCeet commented on GitHub (Jan 2, 2022):
Since 0.107, I’m having this issue too. Only noticed on iPhone safari browser.
@stale[bot] commented on GitHub (Apr 16, 2022):
This issue has been automatically marked as stale because it has not had recent activity. It will be closed if no further activity occurs. Thank you for your contributions.
@TheCeet commented on GitHub (May 2, 2022):
Issue is still happening, desktop view & mobile browser.
@Iam-lcl commented on GitHub (Jul 21, 2023):
It appears that if the svg path for the chart begins with
M0,32then there is a CSS that moves the chart down, probably as this would be the zero-line?Changing the first coordinate to anything else than
M0,32ex.M0,31then the chart will get displayed correctly.Chart that is all zero
@TheCeet commented on GitHub (Apr 9, 2024):
@ainar-g Did you see the comment from @Iam-lcl above?
Possible fix